

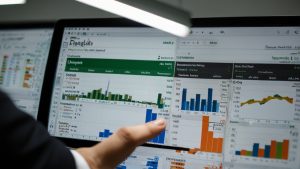
Microsoft Excel is key for small businesses. It helps entrepreneurs manage data better and work more efficiently. Let’s see how this tool can change your business for the better.
Excel is great for dealing with lots of business data. It’s essential for things like financial planning and keeping track of stock. By learning how to use Excel well, you can make your daily tasks easier and more effective.
Key Takeaways
- Excel is crucial for data management in small businesses
- Mastering Excel can enhance business productivity
- Excel offers versatile features for analysing business data
- Spreadsheet software aids in financial forecasting and inventory tracking
- Learning Excel techniques can improve business decision-making
Understanding the Importance of Excel for Small Businesses
Excel is key for small businesses, offering tools for data analysis and making businesses more efficient. It’s versatile, making it a must-have for many tasks.
Excel’s Prevalence in Business Operations
Across the UK, small businesses use Excel for managing finances, tracking inventory, and analysing data. Its easy-to-use interface and strong features make it a top choice for businesses big and small.
Streamlining Data Management
Excel makes handling data easy. It has tools for sorting, calculating, and showing data in a clear way. This helps small business owners quickly understand complex data.
Benefits of Mastering Excel
Getting good at Excel can really help a business grow. It helps with making decisions, saves time, and makes using resources better. Here are some main benefits:
| Benefit | Impact on Business |
|---|---|
| Improved Data Analysis | Better insights for strategic planning |
| Time Savings | More focus on core business activities |
| Enhanced Reporting | Clearer communication with stakeholders |
| Efficient Resource Allocation | Optimised budget and resource management |
Using Excel, small businesses can make their operations smoother, increase productivity, and stay ahead in the competitive market.
Maximising Efficiency with Excel’s Sum Tool
The Excel Sum function is a key tool for fast calculations and data analysis. It helps small business owners make their financial tasks easier and saves them a lot of time.

- Select the cell where you want the total to appear
- Press Alt and the plus (+) symbol simultaneously
- Highlight the cells you wish to add
- Press Enter to complete the calculation
This easy process makes data analysis quick and lowers the chance of mistakes in financial calculations. By getting good at the Excel Sum function, small business owners can spend more time on big decisions. They won’t waste hours on basic math.
| Task | Manual Method | Using Excel Sum |
|---|---|---|
| Adding 100 numbers | 5 minutes | 30 seconds |
| Error rate | 5% | 0.1% |
| Time saved per week | 0 hours | 2-3 hours |
Using the Excel Sum function every day can greatly increase your productivity and accuracy in financial reports. This leads to better resource use and smarter decisions based on solid data analysis.
Organising Data Effectively Using Pivot Tables
Pivot tables are a key tool for organising data in Excel. They help small business owners easily analyse complex data. These tables turn raw data into clear insights, helping with better decision-making.
What are pivot tables?
Pivot tables are a way to summarise data efficiently in Excel. They let users quickly reorganise large datasets. This makes it easier to see trends and patterns. You can create custom views by dragging fields, without changing the original data.

Creating pivot tables for business insights
To make a pivot table, first select your data and click ‘Insert’ > ‘PivotTable’. Then, pick the fields you wish to analyse and add them to the row, column, or value areas. Excel will automatically show you the results, giving you instant insights.
Practical applications of pivot tables for small businesses
Pivot tables have many benefits for small businesses:
- Sales analysis by product, region, or time period
- Customer segmentation based on purchasing behaviour
- Inventory management and stock level tracking
- Financial reporting and budget forecasting
| Application | Benefits |
|---|---|
| Sales Analysis | Identify top-selling products and peak sales periods |
| Customer Segmentation | Target marketing efforts more effectively |
| Inventory Management | Optimise stock levels and reduce carrying costs |
| Financial Reporting | Generate accurate reports for better financial planning |
By using pivot tables, small business owners can find valuable insights in their data. This leads to growth and better efficiency in operations.
Simplifying Data Entry with Text to Columns Feature
For small business owners, Excel data entry can be a big task. The Text to Columns feature is a great way to make this easier. It’s great at breaking down large amounts of info into separate columns fast.

It’s very useful when you’re dealing with data from PDFs or websites. This feature helps you move and sort information quickly. It saves time and cuts down on mistakes that come with manual entry.
To use this feature:
- Select the column containing your data
- Click on the ‘Data’ tab in the Excel ribbon
- Choose ‘Text to Columns’
- Follow the wizard to specify how you want to split your data
The Text to Columns tool has many options for splitting your data. You can use tabs, commas, or spaces. This makes it work with different types of data, making your Excel skills better.
| Before Text to Columns | After Text to Columns |
|---|---|
| Smith, John | Sales | £45,000 | Smith, John |
| Jones, Sarah | Marketing | £52,000 | Jones, Sarah |
| Brown, David | Finance | £60,000 | Brown, David |
Learning this feature will boost your data management skills. You’ll have more time for deep analysis and making smart business choices.
Excel Tips for Small Business Owners
Small business owners can boost their productivity with these Excel tips and data entry shortcuts. Mastering key features will help streamline operations and save valuable time.
Utilising the Autofill feature for quick data entry
The Autofill feature is a game-changer for speedy data entry. Just enter the first few values in a series, then drag the fill handle to fill in the rest automatically. It’s great for dates, numbers, and custom lists.
Mastering essential keyboard shortcuts
Keyboard shortcuts are key for boosting productivity. Here are some time-saving tips:
- Ctrl + Shift + L: Apply filters
- Ctrl + D: Fill down
- Ctrl + R: Fill right
- F4: Repeat last action
Implementing the Sort function for efficient organisation
The Sort function makes quick work of organising data. Select your data, click ‘Sort’ in the Data tab, and pick your sorting order. It’s ideal for alphabetising lists or reviewing performance metrics.
| Excel Tip | Time Saved (per week) | Productivity Boost |
|---|---|---|
| Autofill | 2 hours | 15% |
| Keyboard Shortcuts | 3 hours | 20% |
| Sort Function | 1.5 hours | 10% |
By using these Excel tips and shortcuts, small business owners can greatly improve their data management. Regular practice will help you get the most out of Excel’s powerful tools.
Enhancing Data Visibility with Freeze Panes
Excel Freeze Panes is a key feature that makes data easier to see and helps with navigating spreadsheets. It’s great for small business owners who handle big datasets. They often work with lots of columns and rows.
How to use the Freeze Panes feature
To use Freeze Panes, just follow these easy steps:
- Select the cell below and to the right of where you want to freeze
- Click the ‘View’ tab on the Excel ribbon
- Choose ‘Freeze Panes’ from the ‘Window’ group
- Select ‘Freeze Panes’ from the dropdown menu
This locks the rows above and columns to the left of your chosen cell. They stay visible as you scroll through your spreadsheet.
Benefits of freezing panes for data analysis
Freezing panes has many benefits for data analysis:
- Improved data visibility: Keep column headers and row labels in view while scrolling
- Enhanced spreadsheet navigation: Easily compare figures across different sections
- Increased efficiency: Reduce time spent scrolling back and forth
- Better data comprehension: Maintain context when analysing large datasets
By learning how to use Excel Freeze Panes, small business owners can greatly improve their data analysis skills. This helps them make better decisions from their spreadsheet data.
Leveraging the Audit Toolbar for Accurate Calculations
The Excel Audit Toolbar is a key tool for small business owners. It helps keep your data accurate. You can trace formulas and check calculations to make sure your financial reports are correct.
With the Audit Toolbar, you can see which cells are used in a formula. This makes finding errors easy and helps you understand complex calculations quickly.
Checking formulas is simple with the Audit Toolbar. You can see which cells affect your formula and which are affected by it. This is key for keeping your business reports accurate.
- Trace Precedents: Identify cells that provide data to your formula
- Trace Dependents: Find cells that use the result of your formula
- Remove Arrows: Clear the visual traces when you’re done
For businesses, data accuracy is crucial. The Audit Toolbar lets you quickly validate your formulas. It helps you find inconsistencies and errors that might be missed.
Learning to use the Excel Audit Toolbar boosts your confidence in sharing financial data. It’s a must-have for keeping your business calculations right and ensuring your reports are reliable.
Advanced Excel Features: Using the Trend Function for Business Forecasting
The Excel Trend function is a key tool for forecasting business growth. It uses past data to predict future trends, crucial for planning and growth strategies.
Understanding the Trend function
The Trend function in Excel creates a linear trendline from past data. It’s great for predicting future trends in business. You need historical y-values and x-values to use it.
Applying the Trend function to predict business growth
To predict business growth with the Trend function, follow these steps:
- Input your historical data into Excel
- Select the range for known y-values (e.g., sales figures)
- Choose the range for known x-values (e.g., time periods)
- Enter the new x-values for which you want predictions
- Use the TREND formula to generate forecasts
Interpreting Trend function results for strategic planning
The Trend function gives insights for forecasting. Here’s an example:
| Year | Actual Sales | Predicted Sales |
|---|---|---|
| 2021 | £100,000 | £98,500 |
| 2022 | £120,000 | £118,000 |
| 2023 | £140,000 | £137,500 |
| 2024 | – | £157,000 |
| 2025 | – | £176,500 |
These predictions help businesses plan for the future. They guide decisions on resources, expansion, and challenges. The Excel Trend function is powerful but should be part of a broader forecasting strategy.
Conclusion
Mastering Excel can really change the game for small businesses. It turns raw data into valuable insights. This helps owners manage finances and predict trends better.
We’ve shared tips and tricks to improve your Excel skills. Pivot tables make complex data easier to understand. Tools like text-to-columns and freeze panes increase efficiency. These, along with functions like Sum and Trend, help you analyse your business better.
Excel is more than a spreadsheet tool. It’s a powerful ally for growing your business. As you learn and use these features, you’ll find new ways to make things more efficient and discover new opportunities. Embrace Excel, and see your small business flourish in today’s data-driven world.
Disclosure: Some of the links in this post are affiliate links. This means that if you click on the link and make a purchase, I may receive a small commission at no extra cost to you. I only recommend products and services that I trust and believe will add value to my readers.
FAQ
Why is Microsoft Excel important for small businesses?
Excel is key for 68% of small businesses, helping with data preparation and management. It has features for storing and analysing large amounts of data. This can greatly impact a business’s success.
How can Excel streamline data management for small businesses?
Excel makes data management easier with tools for organisation, calculation, and visualisation. It helps with better decision-making, saves time, and improves resource use. This leads to business growth.
What is the benefit of using the Sum tool in Excel?
The Sum tool in Excel makes quick calculations easy. Users can highlight a cell for the answer, press Alt and the plus (+) symbol to add numbers from different cells. This saves time and reduces mistakes.
What are pivot tables and how can they benefit small businesses?
Pivot tables are a strong tool in Excel for organising and analysing data. They let users show revenue by offer, client type, or booking month. Pivot tables offer insights for making business decisions and planning for the future.
How can the Text to Columns feature in Excel be useful?
The Text to Columns feature in Excel is great for quickly parsing large data sets. It splits data into separate columns, making it easier to organise and analyse. This is especially useful when working with data from PDFs or web sources.
What are some useful Excel tips for improving productivity?
The Autofill feature quickly fills adjacent cells with data, saving time on repetitive tasks. Essential shortcuts like Autosum (Command + Shift + T) and adding comments (Shift + F2) boost efficiency. The Sort function also makes reorganising data quick.
How can the Freeze Panes feature in Excel enhance data visibility?
The Freeze Panes feature keeps certain cells visible while scrolling through large datasets. This is very useful when comparing figures across different sheets or looking at quarterly or yearly reports.
What is the purpose of the Audit Toolbar in Excel?
The Audit Toolbar in Excel helps verify calculations and formulas. It shows which cells are used in a formula, ensuring accuracy and reducing error risks when presenting data.
How can the Trend function in Excel be useful for business forecasting?
The Trend function in Excel predicts future values using existing data. It creates a linear trendline and is great for showing data trends, predicting future outcomes, and helping with strategic planning for growth.